


Spreadsheet Models for Managers
Getting Access to Spreadsheet Models for Managers
If  you use Excel to model businesses, business processes, or
business transactions, this course will change your life. You’ll learn how to create tools for yourself that will amaze
even you. Unrestricted use of this material is available in two ways.
you use Excel to model businesses, business processes, or
business transactions, this course will change your life. You’ll learn how to create tools for yourself that will amaze
even you. Unrestricted use of this material is available in two ways.
- As a stand-alone Web site
- It resides on your computer, and you can use it anywhere. No need for Internet access.
- At this Web site
- If you have access to the Internet whenever you want to view this material, you can purchase on-line access. Unlimited usage. I’m constantly making improvements and you’ll get them as soon as they’re available.
To Order On Line
| Order "Spreadsheet Models for Managers, on-line edition, one month" by credit card, for USD 69.95 each, using our secure server, and receive download instructions by return email. |
| Order "Spreadsheet Models for Managers, on-line edition, three months" by credit card, for USD 199.00 each, using our secure server, and receive download instructions by return email. |
| Order "Spreadsheet Models for Managers, downloadable hyperbook edition" by credit card, for USD 199.00 each, using our secure server, and receive download instructions by return email. |
To Order by Mail
Make your check payable to Chaco Canyon Consulting, for the amount indicated:
|
And send it to: Chaco Canyon Consulting 700 Huron Avenue, Suite 19C Cambridge, MA 02138 |
To use the course software you’ll need some other applications, which you very probably already have. By placing your order, you’re confirming that you have the software you need, as described on this site.

Spreadsheet Models for Managers
This reading is especially relevant for Session 12Service Systems
Service systems are systems in which customers arrive and are serviced — the airline check-in counter, the order counter of a fast-food restaurant.
This page gives some explanations of the formulas for service system performance parameters. You don’t need to read this to do the homework, but if you’re curious about where the formulas come from, read on.
Assumptions
In modeling service systems, we’ll make three simplifying assumptions.
The arrival rate is constant, and arrivals are described by a Poisson distribution with parameter l. This is just a fancy way of saying that customer arrivals are independent of each other.
The service rate is constant, and the distribution of service completion times is described by an exponential distribution with parameter m.
The system is in equilibrium — that is, the doors to the facility opened a long time ago. We must assume this because just after the doors open, there is nobody in line, and it takes a while for things to settle, which makes it a lot more difficult to describe.
From these assumptions, we’ll derive relationships for some important performance parameters of a service system. These formulas are useful in decision-making regarding capacity utilization for the system. The quantities that are most useful in describing the system are.
- Ls: the average number of customers in the system, either waiting in line or being serviced.
- Ws: the total elapsed time to get through the system, including both waiting time and service time.
- Lq: the average number of customers in the queue.
- Wq: the average elapsed time spent waiting in the queue.
- Pn: the probability that there are n customers in the system.
- Pn>k: the probability that there are more than k customers in the system.
- ρ: the average utilization rate of the server. This is the fraction of the time that the server isn’t idle.
- La: the average length of non-empty lines.
- Wa: the average waiting time for customers who actually have to wait.
As you’ll see, the convention in these formulas is to use Greek letters to represent some of the parameters of this model. If you’re unfamiliar with the Greek alphabet, this can be a little challenging, but not to worry, there are only three symbols in use here. The Greek letters we use are λ (called “lambda”), for the mean arrival rate of new customers; μ (called “mu”), for the mean service rate; and ρ (called “rho”), which is the ratio λ/μ.
Single-server systems
A most important relationship is the Fundamental Balance Equation, which is based on the equilibrium assumption. If we let Pn be the probability that there are n customers in the system, either waiting in line or being served, then
λPn-1 = μPn
What does this mean? Just that since we’re in equilibrium, on average the number of customers in the system can’t change. Thus if there are n-1 customers, the probability that we go to n in the next interval of time t is λtPn-1. Similarly, if there are n customers in the system, the probability that we finish one is μtPn. These two probabilities must be equal if we want to stay in equilibrium:
λtPn-1 = μ t Pn
and we see that the factor of t on both sides can be eliminated.
We can use the Fundamental Balance Equation to derive the average number of customers in the system. We’ll do this by first calculating the probability Pn that there are n customers in the system. Let P0 be the probability that there are no customers in the system and P1 be the probability that there is one customer in the system. Then
and
Continuing in this way Pn = (λ/μ)nP0. Now since
it follows that
Here we assumed that λ < μ, in order to close the sum of powers of λ/μ. This sum is just a geometric progression. Unless this assumption is valid, the sum of powers is infinite. But this assumption is the only interesting case anyway, because if μ < λ, the waiting lines become infinite in length and never reach equilibrium. Thus P0 = 1 - λ/μ and
From this we can immediately derive ρ, the utilization rate of the server. Since P0 is the probability of zero customers in the system, it’s also the probability that the server is idle. Thus, the utilization rate ρ of the server is just 1 - P0, so
Another performance measure of interest is the probability that there are fewer than j customers in the system:
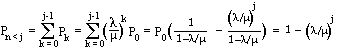
Thus
Now that we know the probability of there being n customers in the system, it’s relatively simple to figure out the average number of customers in the system.
We won’t prove it, but this last form can be rewritten as
We can also derive a relationship between Ls and Ws. Let’s think about the state of the system just after a customer has been serviced. On average there are then Ls customers in the system, and they have all arrived in the time it took that last customer to get through the system. On average, the time it took that last customer to get through the system was Ws, so the average number of new customers that arrived in that time was λ Ws. Thus
Since we have already have an expression for Ls in terms of λ and μ, we have
Let’s now find expressions for the average length of the queue, and for the time spent waiting in the queue. For some businesses, these attributes of the system are critical determiners of customer satisfaction (or dissatisfaction!), and they also determine the size of the waiting facility.
Consider the state of the system just after a customer is called to be serviced. On average there are then Lq customers in the queue, and they have all arrived in the time it took that last customer to be called by the server for service. On average, the time it took that last customer to get through the queue was Wq, so the average number of new customers that arrived in that time was λ Wq. Thus
Since μ is the average number of customers serviced per unit time, the average time required to service a customer is 1/μ. And since the average total time spent in the system is equal to the average time spent waiting in line plus the average time spent being serviced,
Since we know how to express Ws in terms of λ and μ, it follows that
To find the average length of non-empty lines, we divide the average length of a queue by the probability that there is a queue at all:
The expected waiting time for those who actually wait is the average time to service La customers:
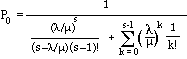
Multi-server systems
When a single service line feeds multiple servers, as in airline passenger ticketing facilities, the average service rate is just a multiple of the service rate for a single server. Suppose there are s servers in the system. Then if the average service rate for a single server is μ, the average service rate for the multiple server system is sμ.
Things are now complicated due to the numbers of different ways the servers can be occupied. Although the Fundamental Balance Equation for the multiple server system is just
The other relations we “derived” so easily for the single-server system are no longer so simple. Here they are:
Last Modified: Wednesday, 27-Apr-2016 04:15:26 EDT
Modeling service systems in general is extraordinarily complex, but as we’ve seen, if we make reasonable approximations, we can gain powerful tools that are very easy to apply. In the case of service systems, we assumed that the system was at equilibrium or close to it. Analogously, we can make simplifying assumptions for many other complex questions. Examples are process control, resource scheduling, resource allocation, cost allocation, vehicle routing, and many more.